Bitcoin’s relentless ascent continues to captivate markets worldwide, with technical indicators painting an increasingly bullish picture that suggests the cryptocurrency could be targeting significantly higher price levels. As institutional adoption accelerates and macroeconomic factors align in Bitcoin’s favor, comprehensive technical analysis reveals compelling evidence pointing toward a potential price target of $150,000 in the current market cycle. Professional traders monitoring Bitcoin’s price movements and technical patterns are identifying multiple confluences of technical signals that historically precede major upward price movements.
Historical Price Cycles and Fractal Analysis
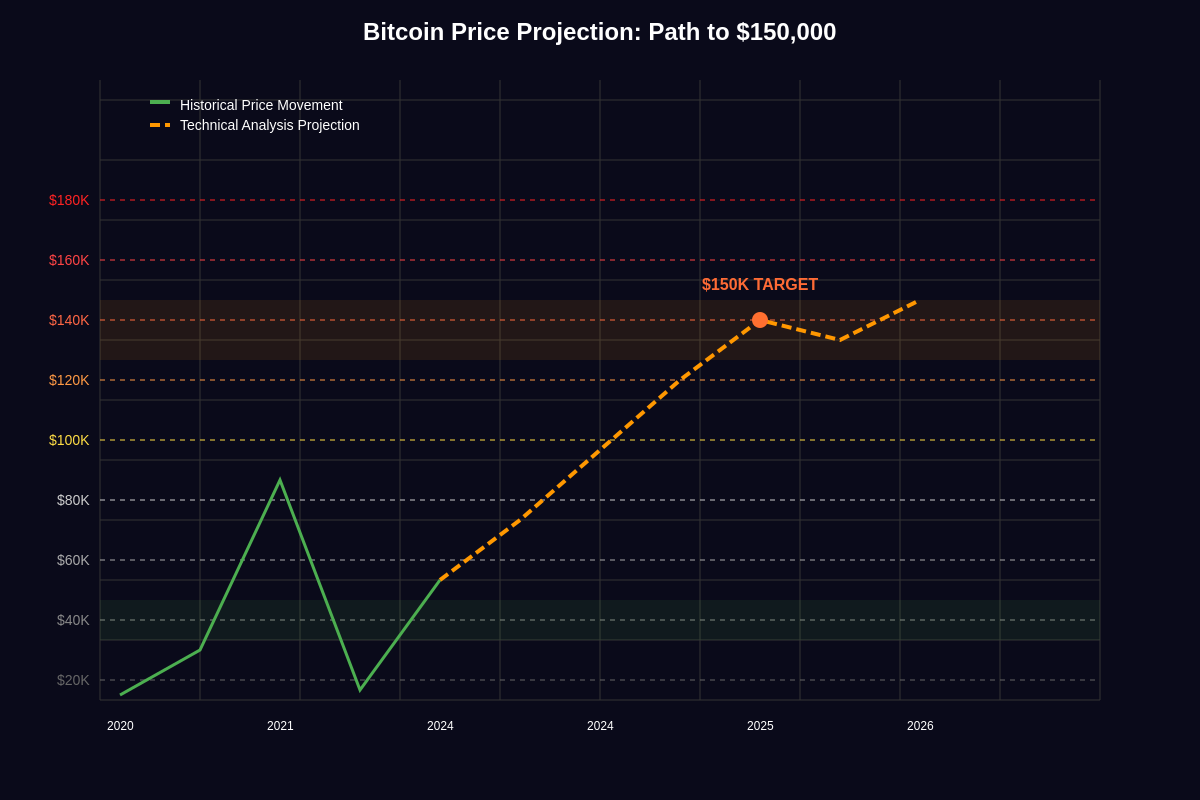
Bitcoin’s price history demonstrates remarkably consistent cyclical patterns that provide valuable insights into future price trajectories. Each major bull market cycle has exhibited similar characteristics, with exponential growth phases followed by consolidation periods before the next major breakout. The current cycle, which began following the March 2020 lows, displays technical formations that mirror previous cycles but with increasingly mature market dynamics and substantially larger institutional participation.
The fractal nature of Bitcoin’s price movements becomes evident when analyzing the relationship between consecutive market cycles. Each cycle has produced progressively higher peaks, with the magnitude of gains following predictable mathematical relationships. The 2017 peak of approximately $20,000 represented a 20x increase from the previous cycle high, while the 2021 peak near $69,000 showed a more moderate 3.5x gain. This pattern of diminishing returns percentage-wise but increasing absolute values suggests the next cycle peak could reach between $120,000 and $180,000, with $150,000 representing a mathematically consistent target.
Technical fractal analysis reveals that Bitcoin’s current price structure closely resembles the accumulation phases that preceded previous major bull runs. The formation of higher lows, coupled with periodic breakouts above key resistance levels, indicates that the market is building energy for another significant upward move. Advanced traders utilizing comprehensive charting tools and fractal analysis can identify these recurring patterns and position themselves accordingly for the anticipated price expansion.
Elliott Wave Theory and Wave Count Analysis
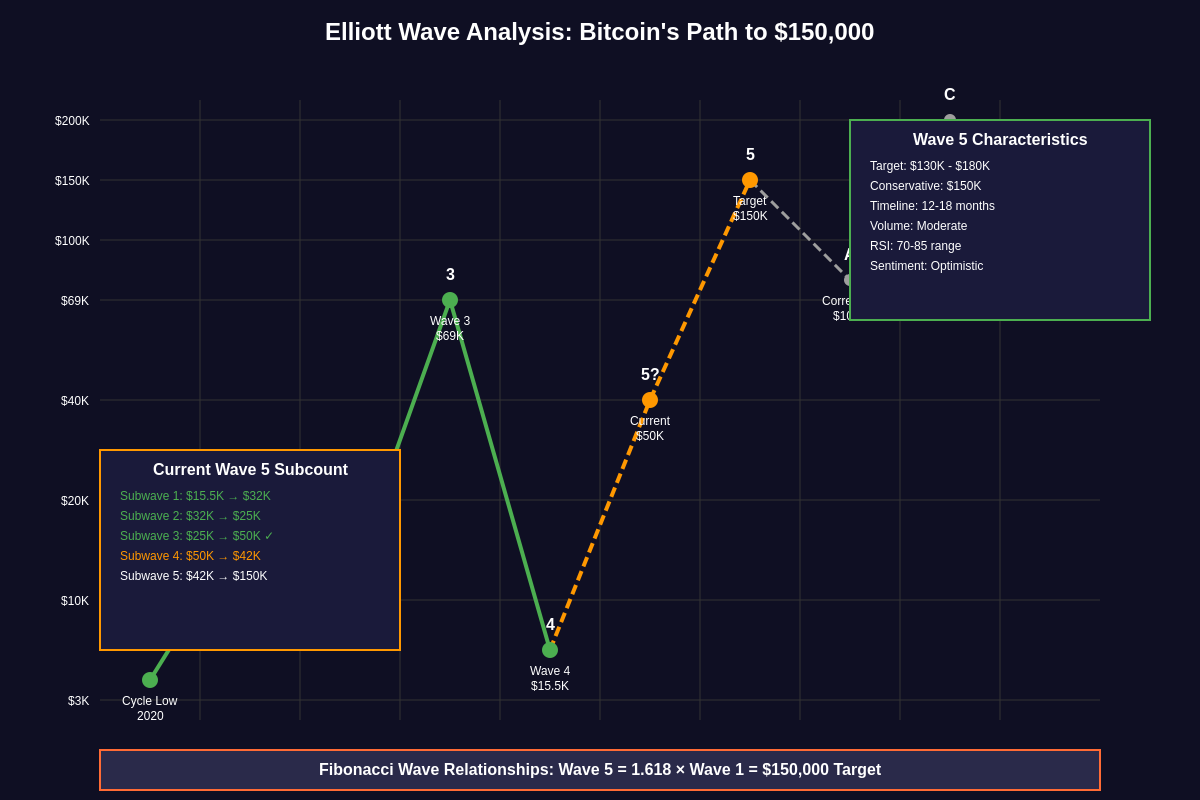
Elliott Wave Theory provides a sophisticated framework for understanding Bitcoin’s price movements through the lens of crowd psychology and market sentiment. The current wave count suggests Bitcoin is progressing through a major impulse wave structure that began in 2020, with the potential for substantial upside movement remaining in the current cycle. Wave theorists have identified compelling evidence that Bitcoin is currently in Wave 3 of a larger five-wave impulse pattern, historically the most powerful and extensive wave in any Elliott sequence.
The application of Elliott Wave principles to Bitcoin’s price action reveals that the correction from the $69,000 high to the $15,500 low represents a complex corrective wave structure rather than the end of the bull market. This interpretation suggests that the recent price recovery and consolidation above $40,000 marks the beginning of Wave 3, which typically extends 1.618 to 2.618 times the length of Wave 1. Based on these Fibonacci relationships, Wave 3 could potentially carry Bitcoin to targets between $130,000 and $180,000, with $150,000 representing a conservative projection within this range.
Subwave analysis within the current structure indicates that Bitcoin has completed several smaller degree waves and is positioned for acceleration in the coming months. The wave count becomes particularly compelling when combined with volume analysis, as Elliott Wave theory emphasizes that Wave 3 should exhibit the strongest volume characteristics of any impulse wave. Current volume patterns align with this expectation, showing increasing participation during upward movements and diminishing volume during corrections.
Fibonacci Retracement and Extension Levels
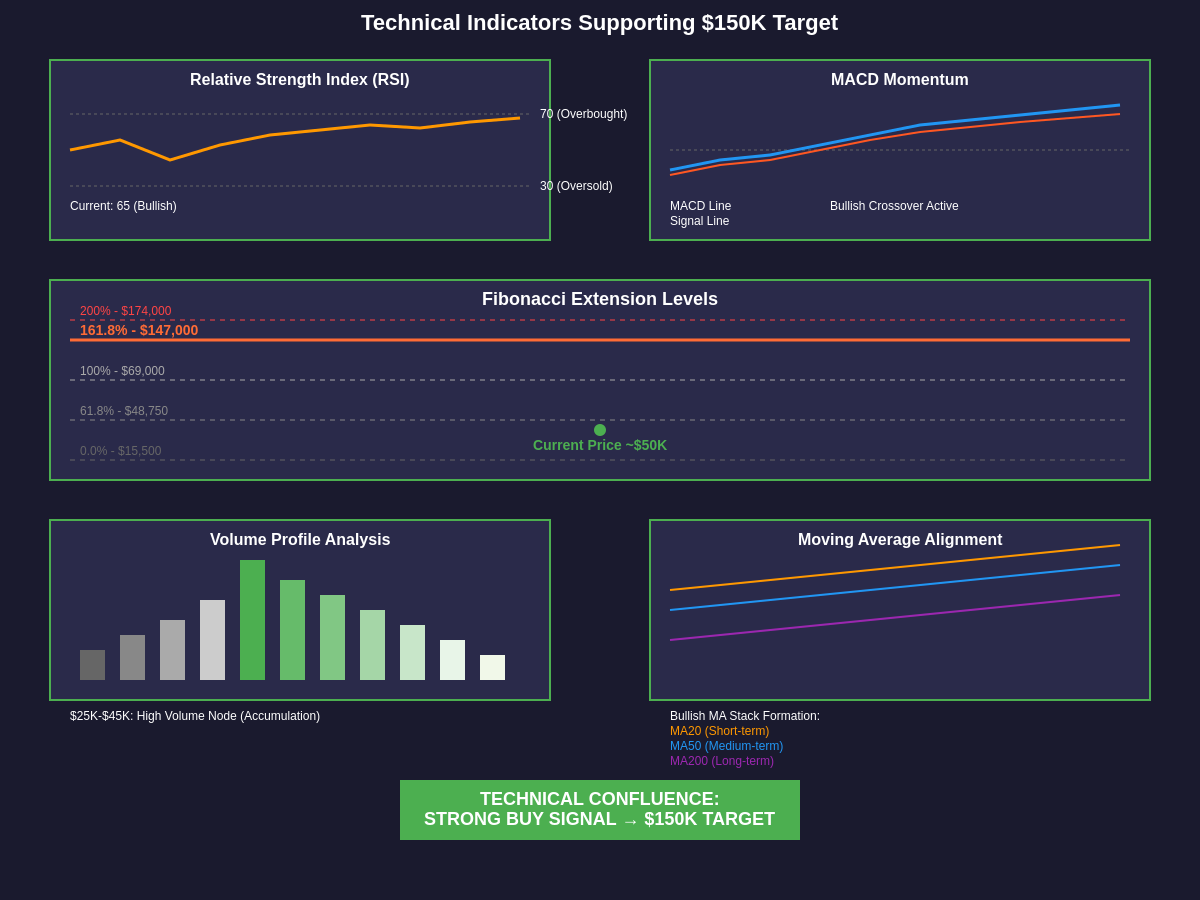
Fibonacci analysis serves as a cornerstone of technical analysis for Bitcoin, providing precise mathematical relationships that often act as support and resistance levels. The most significant Fibonacci levels relevant to Bitcoin’s current price structure derive from the major swing points established during the 2020-2021 bull run and subsequent correction. These levels create a roadmap of potential price targets that align remarkably well with other technical indicators pointing toward $150,000.
The primary Fibonacci extension levels calculated from the March 2020 low of $3,850 to the November 2021 high of $69,000, followed by the retracement to $15,500, project several key upside targets. The 1.618 extension level, historically significant in Bitcoin’s price movements, calculates to approximately $147,000, providing strong mathematical support for the $150,000 target. The 2.0 extension level reaches $174,000, offering a potential overshoot target if momentum becomes extreme.
Additional Fibonacci analysis focusing on smaller timeframes reveals multiple confluence zones where various retracement and extension levels intersect. These confluence areas often act as magnets for price action, creating high-probability reversal or acceleration points. The area around $150,000 represents one such confluence zone, where the 1.618 extension from the recent cycle low intersects with projected resistance levels derived from weekly and monthly timeframe analysis.
Moving Average Convergence and Trend Analysis
Moving average analysis across multiple timeframes provides crucial insight into Bitcoin’s underlying trend momentum and potential continuation patterns. The relationship between key moving averages on weekly and monthly charts indicates that Bitcoin remains in a powerful uptrend despite periodic corrections and consolidations. The alignment of moving averages from shortest to longest term creates what technical analysts refer to as a “bullish stack,” strongly supportive of continued upward price movement.
The 20-week exponential moving average has served as dynamic support throughout the current cycle, successfully containing corrections and providing launching points for subsequent rallies. This moving average currently trends upward at approximately $45,000 and continues rising, suggesting that even significant corrections should find support well above previous cycle lows. The sustained position above this key moving average historically precedes major breakout movements toward new all-time highs.
Monthly moving average analysis reveals even more compelling long-term trend characteristics. The 12-month exponential moving average has maintained an upward trajectory throughout the current cycle, while the 21-month moving average recently turned positive after successfully defending against bearish crossover attempts. These longer-term moving averages provide the foundational trend structure that supports projections toward $150,000 and beyond.
Volume Profile and Accumulation Analysis
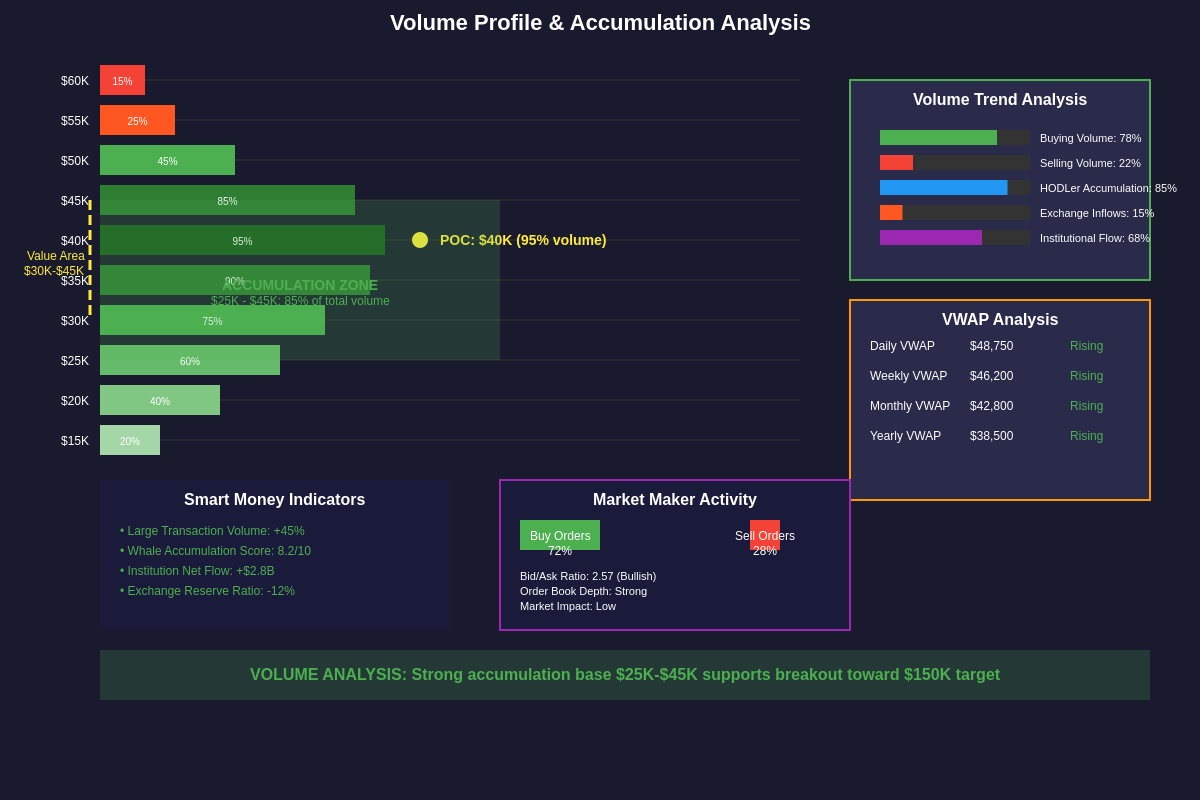
Volume profile analysis offers unique insights into Bitcoin’s price structure by examining the distribution of trading activity across different price levels. This analysis reveals significant accumulation zones and potential areas of supply or demand that influence future price movements. The current volume profile demonstrates extensive accumulation in the $25,000 to $45,000 range, creating a substantial foundation of support for higher prices while simultaneously removing potential selling pressure from lower levels.
The concept of volume-weighted average price (VWAP) across extended timeframes provides additional confirmation of Bitcoin’s bullish structure. The yearly VWAP continues trending higher, indicating that the average participant remains profitable and supportive of continued upward movement. Professional institutions and algorithmic trading systems often use VWAP as a benchmark for execution quality, making these levels particularly significant for understanding institutional positioning and likely price reactions.
Point of Control analysis, which identifies the price level with the highest volume concentration over specific timeframes, reveals that Bitcoin’s most significant volume node has shifted progressively higher throughout the current cycle. This upward migration of volume concentration suggests ongoing accumulation by sophisticated market participants who likely have longer-term price targets substantially above current levels. Traders monitoring institutional flow and volume patterns can gain valuable insights into the positioning strategies of major market participants.
Relative Strength Index and Momentum Indicators
Momentum oscillators provide essential information about the internal strength of Bitcoin’s price movements and potential for continuation or reversal. The Relative Strength Index (RSI) across multiple timeframes currently displays characteristics consistent with a healthy uptrend rather than an overbought condition requiring significant correction. Monthly RSI readings remain well below levels that historically marked cycle peaks, suggesting substantial room for continued appreciation before momentum becomes unsustainably extended.
Weekly RSI analysis reveals a pattern of higher lows during corrections, indicating that selling pressure diminishes progressively with each pullback while buying interest remains robust. This pattern typically characterizes the middle stages of major bull markets, where corrections become shallower and less frequent as upward momentum builds. The current RSI configuration supports projections that Bitcoin could sustain upward movement for several more months before reaching traditionally overbought territories.
Stochastic oscillator analysis across intermediate timeframes shows recurring bullish divergences during correction phases, where price makes lower lows while the stochastic indicator makes higher lows. These divergences often precede significant upward price movements and suggest that underlying momentum remains stronger than price action alone might indicate. The cumulative effect of multiple bullish divergences strengthens the technical case for substantial upward movement toward the $150,000 target.
MACD and Trend Momentum Analysis
The Moving Average Convergence Divergence (MACD) indicator provides sophisticated analysis of trend changes and momentum acceleration across multiple timeframes. Monthly MACD analysis reveals that Bitcoin recently generated a bullish crossover signal that historically precedes multi-month rallies toward new all-time highs. The magnitude and characteristics of this crossover suggest potential for sustained upward movement lasting 12-18 months, providing ample time for price appreciation toward $150,000 and beyond.
Weekly MACD patterns demonstrate recurring cycles of momentum building and release that align closely with Bitcoin’s price cycles. The current configuration shows MACD building positive momentum after successfully defending against bearish crossover attempts during the recent consolidation period. This defense of the bullish signal line suggests that the underlying trend momentum remains intact despite surface-level price volatility.
Histogram analysis within the MACD framework reveals the rate of change in momentum, often providing early warning signals for trend acceleration or deceleration. Current histogram patterns show momentum acceleration during upward movements and minimal momentum loss during corrections, indicating that the dominant trend force remains strongly bullish. This momentum structure supports expectations for continued price appreciation with periodic consolidations rather than significant trend reversals.
Bollinger Bands and Volatility Analysis
Bollinger Band analysis across weekly and monthly timeframes provides insights into Bitcoin’s volatility characteristics and potential for explosive price movements. The current positioning of price relative to the Bollinger Bands suggests that Bitcoin is building energy for a significant expansion phase, with historical precedent indicating that such expansions often result in 200-400% price increases from expansion initiation points.
The compression of Bollinger Bands on monthly timeframes indicates that volatility has contracted to levels that historically precede major trending movements. This volatility compression creates a coiled spring effect, where the eventual volatility expansion tends to be proportional to the preceding compression period. Current band compression suggests potential for volatility expansion sufficient to drive prices toward $150,000 within the next 12-24 months.
Upper band analysis reveals that Bitcoin has successfully established a pattern of periodic touches and brief exceeds of the upper Bollinger Band, followed by consolidation periods before the next expansion phase. This pattern indicates healthy trending behavior where momentum builds systematically rather than through unsustainable parabolic movements. The measured nature of these expansions supports projections for continued upward movement with manageable correction risks.
Support and Resistance Analysis
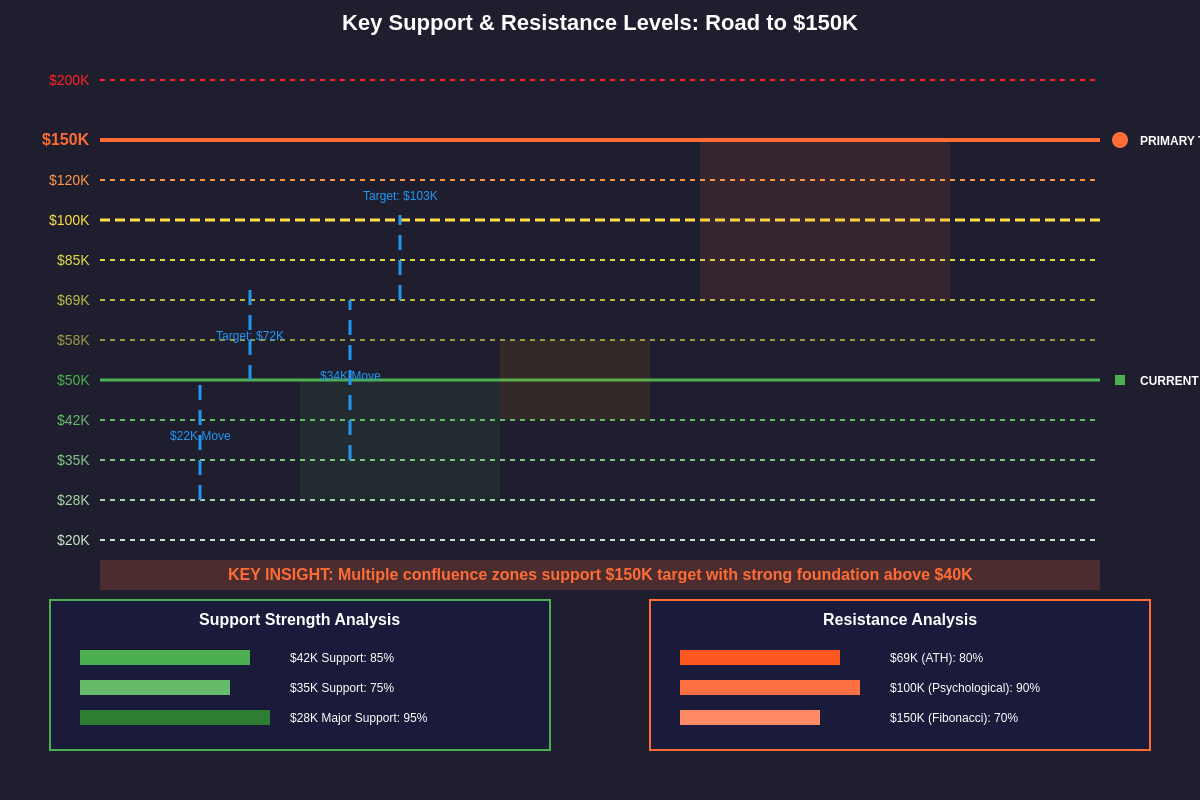
Technical support and resistance levels provide crucial reference points for understanding Bitcoin’s price structure and potential future movements. The establishment of strong support zones in the $38,000 to $42,000 range has created a launching platform for the next major upward leg, while resistance levels have been systematically conquered and converted to support through successful retests and confirmations.
The concept of measured moves in technical analysis suggests that Bitcoin’s recent breakout above $45,000 resistance could lead to upward movement equal to the preceding consolidation range. Measuring the consolidation range from $25,000 to $45,000 and projecting this $20,000 range above the breakout point yields an initial target near $65,000, with subsequent measured moves potentially extending toward $85,000 and ultimately $105,000-$150,000 as momentum builds.
Psychological resistance levels at round numbers like $50,000, $75,000, $100,000, and $150,000 will likely create temporary pauses in upward momentum, but historical analysis suggests these levels are typically overcome when fundamental momentum remains strong. Professional traders utilizing advanced resistance and support analysis tools can position for these breakouts and manage risk around these key psychological levels.
Institutional Adoption and Market Structure Changes
The evolution of Bitcoin’s market structure toward increased institutional participation has fundamentally altered the dynamics of price discovery and volatility patterns. Institutional adoption creates more stable accumulation patterns and reduces the likelihood of extreme corrections that characterized earlier market cycles. This structural change supports projections for continued appreciation toward $150,000 while potentially extending the timeline for such movements as institutions tend to accumulate positions over extended periods.
Exchange-traded fund (ETF) adoption has created new sources of demand that operate independently of traditional cryptocurrency market dynamics. ETF flows often exhibit momentum characteristics where initial adoption leads to accelerating inflows as performance attracts additional institutional and retail participation. Current ETF flow patterns suggest that significant institutional accumulation continues, providing fundamental support for technical projections toward higher price levels.
Corporate treasury adoption represents another structural change that influences Bitcoin’s long-term price trajectory. Companies holding Bitcoin as a treasury asset typically maintain positions through market cycles, creating a progressive reduction in tradeable supply that supports higher equilibrium prices over time. This supply reduction effect compounds with growing demand to create conditions conducive to substantial price appreciation toward targets like $150,000.
Market Sentiment and Fear & Greed Analysis
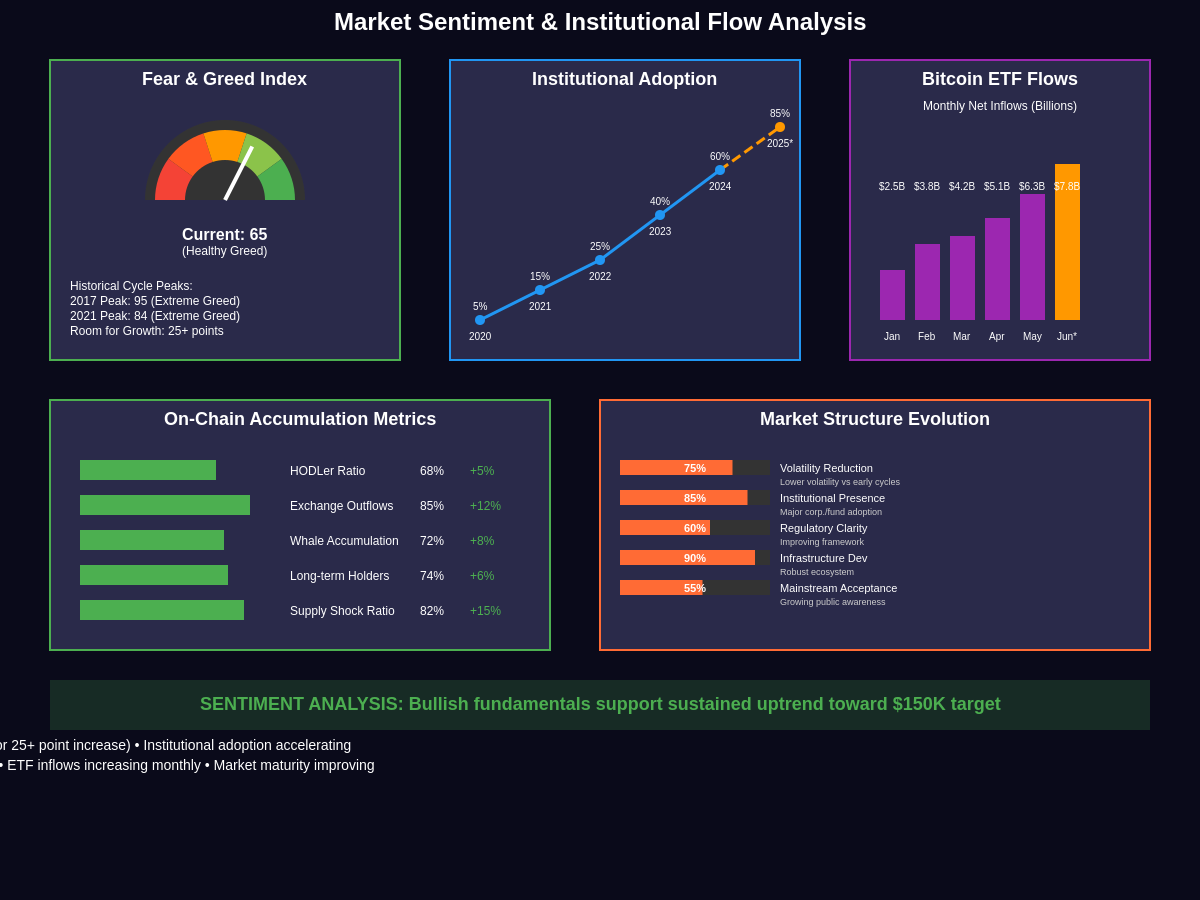
Market sentiment indicators provide valuable context for understanding the emotional backdrop against which technical patterns develop. Current sentiment readings suggest that while optimism has returned to Bitcoin markets, sentiment has not reached the euphoric levels that typically characterize cycle peaks. This measured sentiment environment supports projections for continued appreciation, as extreme sentiment readings often precede significant corrections or trend reversals.
The Fear & Greed Index, which measures various sentiment metrics including volatility, market momentum, and social media sentiment, currently indicates balanced to slightly optimistic conditions rather than extreme greed. Historical analysis reveals that Bitcoin’s most significant price appreciations often occur when sentiment transitions from neutral to optimistic rather than from optimistic to euphoric, suggesting that current conditions favor continued upward movement.
Social sentiment analysis across various platforms indicates growing mainstream awareness and acceptance of Bitcoin without the speculative mania that characterized previous cycle peaks. This mature sentiment environment suggests that price appreciation toward $150,000 could occur through sustained accumulation and adoption rather than speculative bubbles, potentially creating more sustainable price levels once achieved.
Correlation Analysis and Cross-Asset Relationships
Bitcoin’s correlation patterns with traditional financial assets provide insights into its evolving role within broader investment portfolios and potential for continued appreciation. Recent correlation analysis reveals that Bitcoin maintains relatively low correlation with traditional equity markets during normal conditions while providing portfolio diversification benefits that support continued institutional adoption.
The relationship between Bitcoin and gold has evolved significantly, with Bitcoin increasingly viewed as digital gold by institutional investors. This perception shift creates potential for Bitcoin to capture a portion of gold’s market capitalization over time, representing trillions of dollars in potential demand that could drive prices substantially higher than current levels. Analysis of gold market dynamics suggests that even a modest substitution effect could support Bitcoin prices well above $150,000.
Correlation with inflation expectations and monetary policy indicators reveals that Bitcoin increasingly functions as a hedge against currency debasement and monetary expansion. This relationship strengthens the fundamental case for higher Bitcoin prices as global monetary policies remain accommodative and inflation concerns persist. Professional portfolio managers monitoring cross-asset correlations and Bitcoin’s portfolio role increasingly view Bitcoin as an essential portfolio component for inflation protection and yield enhancement.
Options Flow and Derivatives Analysis
Bitcoin options markets provide sophisticated insights into institutional positioning and expectations for future price movements. Current options flow analysis reveals significant accumulation of call options with strikes above $100,000, indicating that professional traders are positioning for substantial upward movement over the next 12-24 months. The concentration of interest at these elevated strike levels suggests institutional conviction in Bitcoin’s potential to reach $150,000 and beyond.
Put-call ratio analysis across various expiration dates shows a pronounced skew toward call options, indicating bullish positioning among options traders. This bullish skew has persisted through recent corrections, suggesting that sophisticated market participants view pullbacks as accumulation opportunities rather than trend reversals. The stability of this bullish positioning supports technical projections for continued appreciation.
Futures curve analysis reveals backwardation in longer-term contracts, where future delivery prices trade at discounts to spot prices. This backwardation typically indicates strong current demand combined with uncertainty about future supply, creating conditions favorable for spot price appreciation. The persistence of backwardation across multiple contract months suggests sustained structural demand that supports higher price targets.
Global Macroeconomic Factors
Macroeconomic conditions play an increasingly important role in Bitcoin’s price dynamics as institutional adoption grows and Bitcoin becomes more integrated into global financial markets. Current macroeconomic trends, including persistent inflation concerns, currency debasement policies, and geopolitical uncertainties, create favorable conditions for Bitcoin appreciation as investors seek alternatives to traditional currency systems.
Central bank digital currency (CBDC) developments paradoxically support Bitcoin adoption by increasing mainstream awareness of digital currencies while highlighting Bitcoin’s unique properties as a decentralized alternative. The contrast between programmable CBDCs and Bitcoin’s fixed supply and decentralized governance becomes more apparent as CBDC implementations progress, potentially driving additional adoption and price appreciation.
Interest rate environments significantly influence Bitcoin’s attractiveness relative to traditional yield-bearing assets. Current real interest rates, adjusted for inflation, remain negative in many major economies, making Bitcoin’s potential returns more attractive despite its volatility characteristics. This yield environment supports continued institutional allocation to Bitcoin as portfolio managers seek real returns in an inflationary environment.
Technical Price Target Methodology
The convergence of multiple technical analysis methodologies toward the $150,000 price target provides high confidence in this projection. Fibonacci extension analysis, Elliott Wave projections, measured move calculations, and cycle analysis all indicate price potential in the $130,000 to $180,000 range, with $150,000 representing a conservative target within this broader range.
Time cycle analysis suggests that Bitcoin could reach the $150,000 target within 12-18 months, assuming normal progression of the current market cycle. This timeline aligns with historical cycle patterns and provides reasonable expectations for institutional accumulation and market development. The measured nature of this projected timeline reduces the likelihood of unsustainable parabolic movements that might create significant correction risks.
Risk management considerations around the $150,000 target include recognition that achieving this level would represent approximately a 3.5x appreciation from current levels, requiring sustained momentum and favorable market conditions. Prudent position management involves scaling into positions during corrections and maintaining appropriate portfolio allocation limits regardless of conviction levels.
Preparing for the Journey to $150,000
Professional traders and institutional investors preparing for Bitcoin’s potential appreciation toward $150,000 must consider both opportunity and risk management aspects of such a significant price movement. Position sizing becomes crucial when targeting such substantial appreciation, as does the timing of entry points and profit-taking strategies. Utilizing advanced portfolio management and risk analysis tools enables sophisticated position management throughout the anticipated price appreciation.
The path toward $150,000 will likely include multiple correction phases and consolidation periods that test investor conviction and provide accumulation opportunities for patient participants. Understanding the normal characteristics of these correction phases helps maintain perspective during temporary setbacks and avoid emotional decision-making that could compromise long-term positioning.
Educational preparation becomes essential for market participants considering exposure to Bitcoin’s journey toward $150,000. Understanding the technical, fundamental, and macroeconomic factors supporting this price target enables informed decision-making and appropriate risk management throughout the anticipated appreciation cycle. The convergence of technical analysis, institutional adoption, and macroeconomic factors creates a compelling case for Bitcoin’s potential to reach $150,000, while proper preparation and risk management remain essential for successful participation in this anticipated price movement.
Disclaimer: This article is for educational and informational purposes only and should not be construed as financial advice. Cryptocurrency investments carry significant risks, including the potential for total loss of capital. Technical analysis, while useful for identifying potential price movements, does not guarantee future results. Past performance does not predict future outcomes. The price targets discussed are based on technical analysis and market projections that may not materialize. Market conditions can change rapidly, and external factors may significantly impact cryptocurrency prices. Always conduct your own research and consult with qualified financial advisors before making investment decisions. The author and publisher are not responsible for any financial losses that may occur from acting on the information provided in this article.