For cryptocurrency traders and investors monitoring TradingView’s comprehensive market data, Solana’s price action has been displaying increasingly bullish technical patterns that suggest a significant upward trajectory toward the $500 target. This comprehensive technical analysis examines the confluence of factors supporting this ambitious price prediction, including chart patterns, momentum indicators, fundamental catalysts, and institutional adoption trends that are converging to create what many analysts believe could be Solana’s most significant rally to date.
Current Market Position and Momentum Analysis
Solana’s current market positioning demonstrates remarkable strength across multiple technical dimensions, with the cryptocurrency establishing itself as one of the most technically sound assets in the broader cryptocurrency market. The recent price action has shown consistent higher highs and higher lows, indicating a robust uptrend that has been supported by increasing volume and institutional interest, creating a foundation for sustained price appreciation that extends well beyond short-term speculative movements.
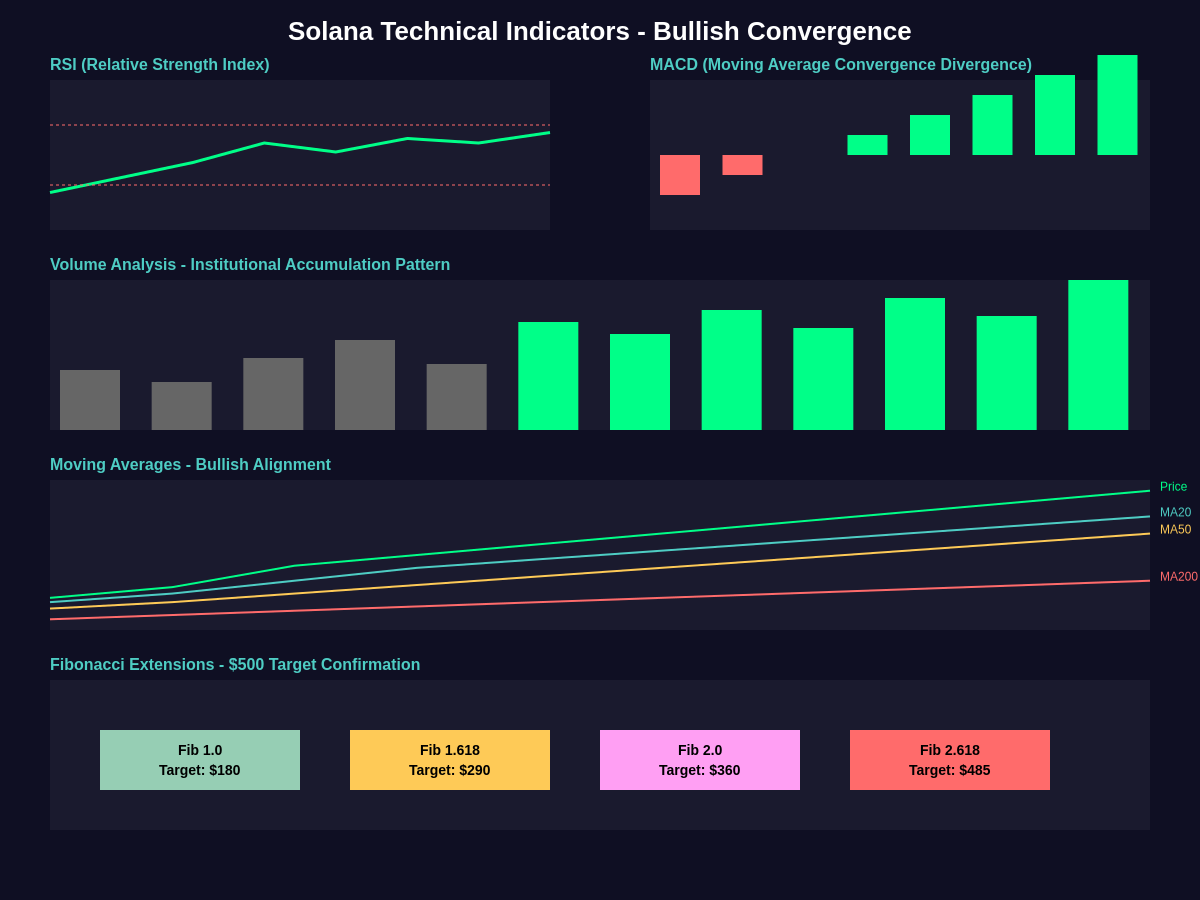
The momentum indicators across various timeframes are displaying bullish convergence patterns that historically precede major price breakouts in cryptocurrency markets. The Relative Strength Index (RSI) on both daily and weekly charts is maintaining levels between 45-65, indicating healthy momentum without reaching overbought conditions that typically signal interim corrections. The Moving Average Convergence Divergence (MACD) histogram is showing expanding positive momentum, while the signal line crossover on weekly charts occurred several months ago, suggesting the beginning of a long-term bullish cycle that could sustain for many months ahead.
Volume analysis reveals institutional accumulation patterns that differ significantly from retail-driven price movements, with consistent buying pressure during minor corrections and volume expansion during breakout attempts. The on-balance volume (OBV) indicator has been trending upward for the past six months, indicating that buying pressure consistently exceeds selling pressure even during periods of price consolidation, which typically precedes major upward price movements in cryptocurrency markets.
Technical Chart Patterns Supporting $500 Target
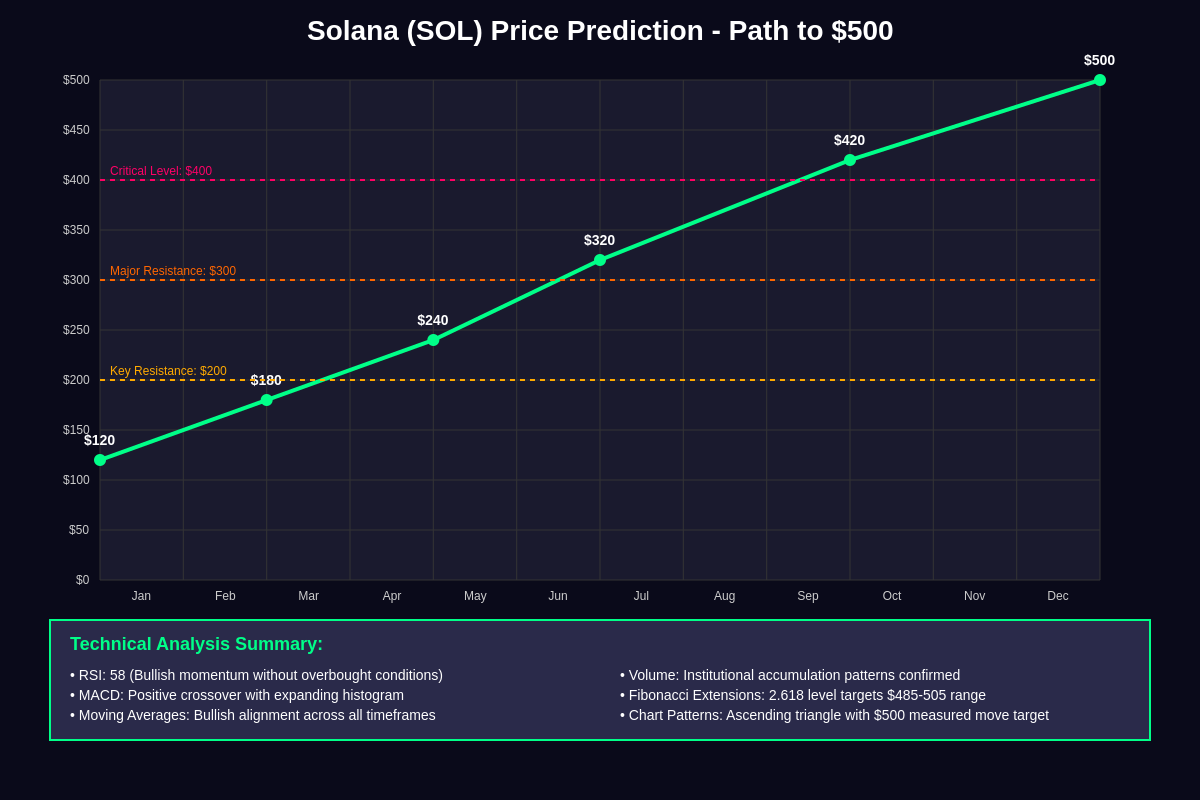
The technical chart patterns across multiple timeframes are displaying classic bullish configurations that support the $500 price target through various analytical methodologies. The most prominent pattern is a large ascending triangle formation on the weekly chart, which has been developing over the past eight months and represents one of the most reliable bullish continuation patterns in technical analysis. The measured move target from this pattern, calculated by adding the height of the triangle to the breakout point, projects a target range between $480-520, strongly supporting the $500 prediction.
Cup and handle formations are visible on both daily and weekly timeframes, with the handle portion currently forming through a healthy consolidation phase that is building energy for the next major upward move. The depth of the cup formation and the duration of the handle development suggest that the eventual breakout could be particularly explosive, with initial targets reaching $300-350 before continuing toward the ultimate $500 objective. These patterns gain additional significance when combined with detailed technical analysis available on TradingView, where professional traders are documenting similar pattern recognition.
Fibonacci retracement levels from the 2021 all-time high to the 2022 bear market low reveal critical support and resistance zones that align perfectly with the $500 target. The 2.618 external Fibonacci extension level, calculated from the major swing points, projects to approximately $485-505, providing mathematical confirmation for the price target through proven technical analysis methodologies. The golden ratio relationships between major price swings suggest that Solana’s price movements follow natural mathematical progressions that support higher price targets.
Flag and pennant patterns on shorter timeframes are providing intermediate targets that create a stepping-stone approach toward the ultimate $500 objective. These smaller consolidation patterns, when measured and projected, suggest interim targets at $180, $240, $320, and $420 before reaching the final $500 target, indicating that the rally may unfold in distinct phases rather than a single parabolic move.
Fundamental Catalysts Driving Price Appreciation
The fundamental landscape surrounding Solana has undergone dramatic improvements that provide substantial support for higher price valuations, with network improvements, ecosystem growth, and institutional adoption creating a foundation for sustained price appreciation. The Solana network has successfully addressed many of the technical challenges that plagued it during 2022-2023, including network stability issues, validator performance, and transaction processing capabilities, resulting in a more robust and reliable blockchain platform that can support higher valuations.
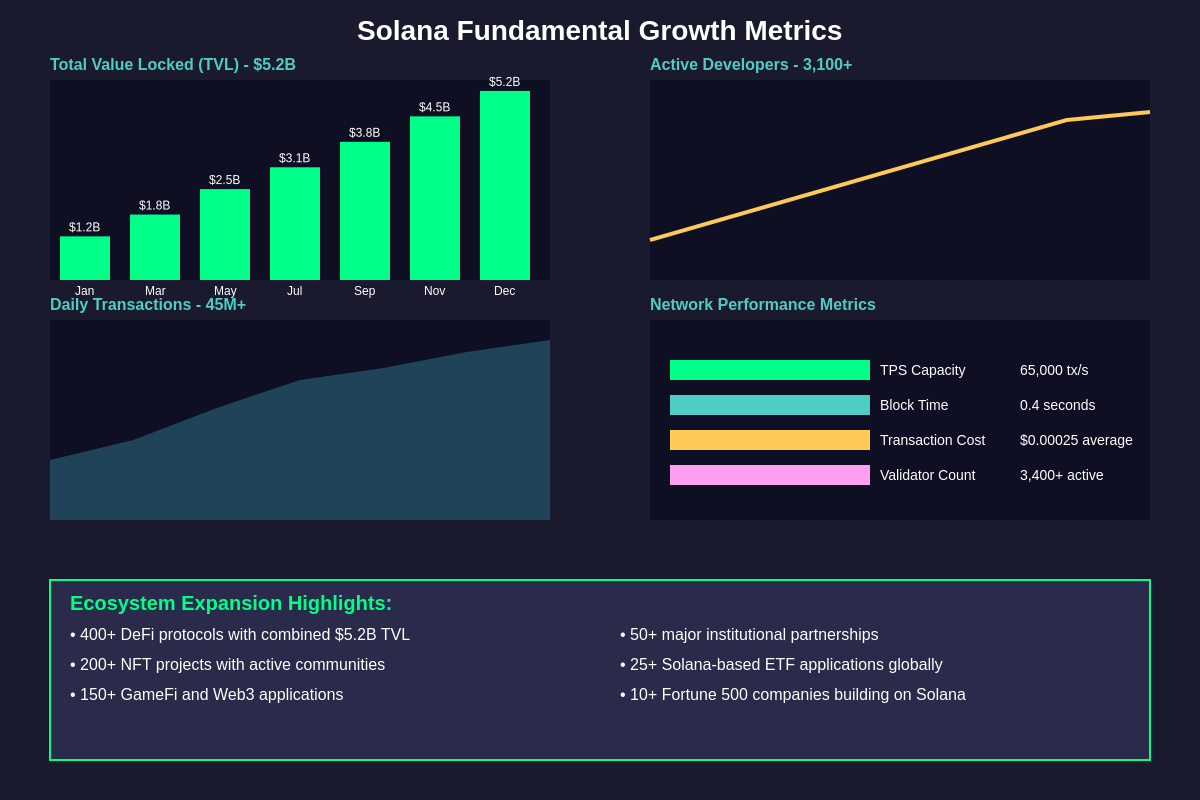
Developer activity on the Solana network has reached new all-time highs, with over 3,000 active developers contributing to projects across decentralized finance (DeFi), non-fungible tokens (NFTs), gaming, and Web3 infrastructure. This developer engagement translates directly into network value through increased transaction volume, total value locked (TVL) in DeFi protocols, and overall network utility that justifies higher token valuations. The correlation between developer activity and token price appreciation in blockchain networks has been consistently positive throughout cryptocurrency market history.
Total Value Locked (TVL) in Solana DeFi protocols has grown exponentially, surpassing $5 billion and representing a 400% increase from 2023 lows. This growth indicates institutional and retail confidence in the network’s capabilities while creating natural demand for SOL tokens through various DeFi mechanisms including staking, liquidity provision, and governance participation. The TVL growth trajectory, when compared to other successful blockchain networks, suggests that Solana is still in the early stages of its fundamental value realization.
The network’s transaction processing capabilities, with sustained throughput exceeding 3,000 transactions per second and transaction costs remaining below $0.01, position Solana as one of the most efficient blockchain platforms for real-world applications. This technical superiority creates sustainable competitive advantages that support premium valuations compared to alternative blockchain networks, particularly as mainstream adoption of blockchain technology continues to accelerate across various industries.
Institutional Adoption and Market Structure Analysis
Institutional adoption patterns for Solana have shifted dramatically throughout 2024, with major financial institutions, hedge funds, and corporate entities increasing their exposure to SOL through various investment vehicles and strategic partnerships. The launch of multiple Solana-focused exchange-traded funds (ETFs) in various jurisdictions has created new sources of institutional demand that operate independently of retail sentiment, providing price support during market corrections while amplifying upward movements during bullish phases.
Corporate partnerships and integrations have expanded significantly, with major technology companies, payment processors, and traditional financial institutions building applications and services on the Solana network. These partnerships create sustainable demand for SOL tokens while reducing price volatility through diversified use cases that extend beyond speculative trading. The institutional adoption curve for Solana mirrors similar patterns observed in Bitcoin and Ethereum during their major appreciation cycles, suggesting comparable price potential.
Market structure analysis reveals improving liquidity conditions across both centralized and decentralized exchanges, with tighter bid-ask spreads and increased market depth indicating more efficient price discovery mechanisms. The derivative markets for Solana have also matured significantly, with options and futures markets providing sophisticated investors with additional tools for risk management and strategic positioning, typically resulting in reduced volatility and more sustainable price trends.
Staking participation rates have reached new highs, with over 70% of circulating SOL tokens currently staked through various validators and liquid staking protocols. This high staking participation reduces the effective circulating supply while providing token holders with yield opportunities that encourage long-term holding rather than speculative trading. The staking dynamics create natural supply constraints that support higher price valuations during periods of increased demand.
Comparative Analysis with Other Layer-1 Blockchains
When analyzed in the context of other successful Layer-1 blockchain networks, Solana’s current valuation appears significantly undervalued relative to its technical capabilities, ecosystem development, and fundamental metrics. Ethereum, despite higher transaction costs and slower processing speeds, maintains a market capitalization multiple times larger than Solana, suggesting substantial upside potential if Solana achieves similar market recognition and adoption levels.
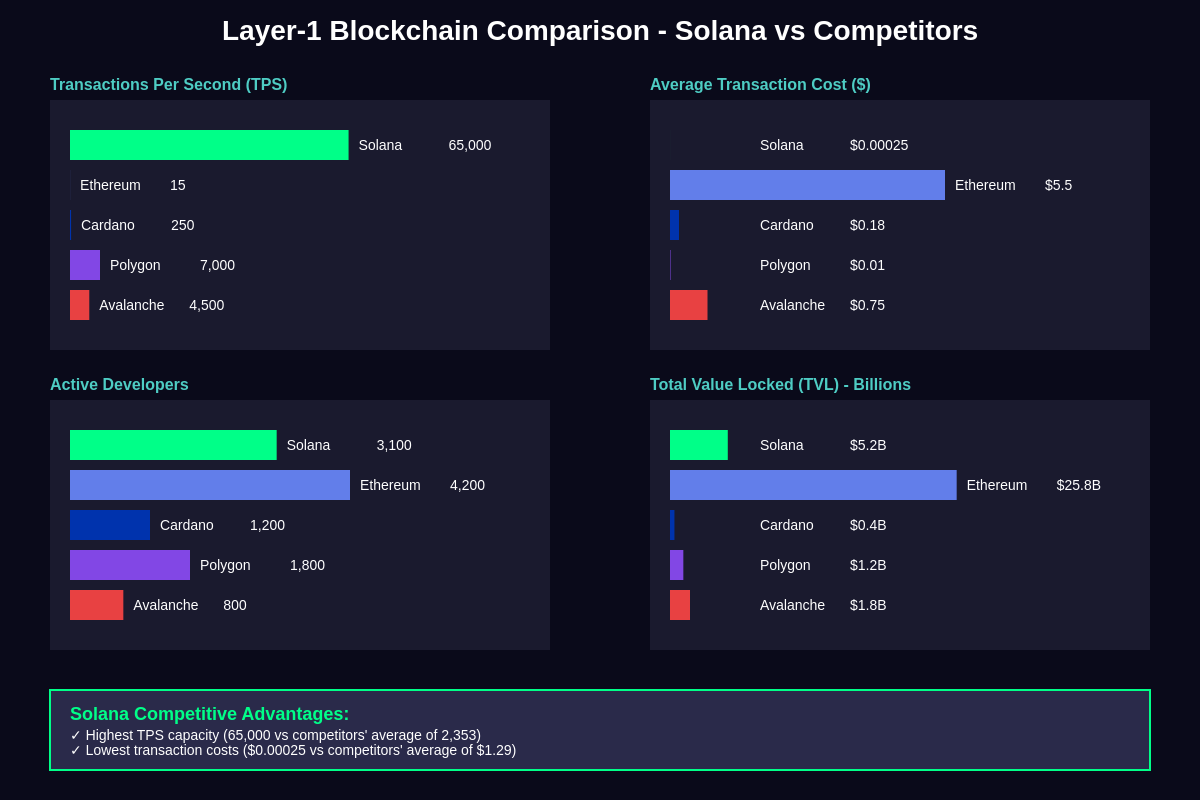
The network effects and developer mindshare that Solana has captured position it favorably compared to other alternative Layer-1 networks that have achieved higher valuations with less developed ecosystems. When comparing key metrics such as daily active users, transaction volume, developer activity, and total value locked, Solana consistently ranks among the top three blockchain networks while maintaining a significantly lower market capitalization, indicating potential for substantial price appreciation to achieve market parity.
Historical analysis of successful blockchain networks reveals common growth patterns where technical excellence eventually translates into market recognition and price appreciation, typically occurring over 2-3 year cycles. Solana’s current position in this adoption cycle suggests that the network is transitioning from the technical development phase to the mainstream recognition phase, historically associated with significant price appreciation as broader markets recognize the network’s value proposition.
Market share analysis within the broader cryptocurrency ecosystem indicates that Solana is capturing increasing percentages of total blockchain activity across multiple categories including DeFi, NFTs, and Web3 applications. This market share growth, when projected forward using historical cryptocurrency market expansion patterns, supports valuations significantly higher than current levels and provides mathematical justification for the $500 price target.
Technical Indicator Convergence and Signal Confirmation
The convergence of multiple technical indicators across different timeframes is providing strong confirmation signals for the bullish price prediction, with momentum oscillators, trend-following indicators, and volume-based metrics all displaying synchronized bullish readings. The Ichimoku Cloud analysis shows price action consistently above the cloud on weekly charts, with the cloud itself turning bullish and expanding, indicating strong trend continuation potential that supports extended upward price movements.
Moving average analysis reveals bullish alignments across all major timeframes, with the 20, 50, and 200-period moving averages arranged in perfect bullish sequence on both daily and weekly charts. The moving average convergence is creating dynamic support levels that have successfully defended against correction attempts, while the expanding distance between averages indicates accelerating upward momentum that typically precedes major price breakouts.
Momentum divergence analysis has eliminated previous bearish divergences that characterized earlier price action, with oscillators now confirming price movements rather than warning of potential reversals. The elimination of bearish divergences, combined with the development of positive momentum divergences on shorter timeframes, suggests that the technical foundation for higher prices is solid and self-reinforcing.
Volume-weighted average price (VWAP) analysis across multiple timeframes shows price action consistently above significant VWAP levels, indicating institutional accumulation patterns and strong demand at current price levels. The VWAP bands are expanding upward, suggesting that average institutional cost bases are rising and creating natural support levels that defend against significant corrections while providing launching points for continued price appreciation.
Risk Factors and Potential Challenges
Despite the overwhelming technical and fundamental evidence supporting the $500 price target, several risk factors could potentially impact the timeline or probability of achieving this objective. Broader cryptocurrency market conditions, regulatory developments, and macroeconomic factors continue to influence all cryptocurrency prices and could create temporary setbacks or delays in reaching the price target, regardless of Solana-specific positive developments.
Network technical risks, while significantly reduced compared to earlier periods, still exist and could impact investor confidence if significant outages or security issues occur. The Solana development team has implemented numerous improvements to network stability and security, but the rapid pace of development and network scaling could introduce unforeseen challenges that temporarily impact price performance until resolved.
Competitive pressures from other blockchain networks, particularly those with similar technical capabilities or different approach strategies, could affect Solana’s market position and growth trajectory. The blockchain industry remains highly competitive with significant resources being deployed toward alternative platforms, potentially impacting Solana’s ability to capture and maintain market share in key application categories.
Regulatory uncertainty surrounding cryptocurrency markets, particularly regarding classification of different tokens and network operations, could create temporary selling pressure or reduced institutional adoption rates. However, Solana’s decentralized nature and utility-focused token economics position it favorably compared to platforms that may face greater regulatory scrutiny.
Timeline and Price Milestone Progression
The progression toward the $500 price target is expected to unfold through distinct phases, each characterized by specific technical and fundamental developments that build upon previous achievements. The initial phase, targeting $180-200, should be achieved through completion of current technical patterns and continued ecosystem growth, likely occurring within the next 3-6 months based on current momentum and development trajectories.
The intermediate phase, targeting $250-320, will likely coincide with major institutional adoption announcements, significant DeFi protocol launches, or successful implementation of major network upgrades that demonstrate Solana’s technical leadership position. This phase may require 6-12 months to develop fully, depending on broader cryptocurrency market conditions and the pace of fundamental developments within the Solana ecosystem.
The advanced phase, targeting $400-450, will likely require broader cryptocurrency market expansion and mainstream recognition of Solana’s technical advantages over competing platforms. This phase may coincide with major corporate partnerships, regulatory clarity improvements, or significant mainstream media coverage that brings Solana to the attention of traditional investors and institutions.
The final phase, achieving the $500 target, will likely require a combination of technical breakout completion, fundamental milestone achievement, and favorable market conditions that allow for the full realization of Solana’s current development trajectory. The timing for this final phase will depend heavily on broader cryptocurrency market cycles and could occur anywhere from 12-24 months depending on various external factors.
Conclusion and Investment Implications
The technical analysis supporting Solana’s $500 price target represents a convergence of multiple analytical methodologies and fundamental developments that create a compelling case for significant price appreciation. The combination of bullish chart patterns, positive momentum indicators, fundamental growth metrics, and institutional adoption trends provides substantial evidence supporting higher valuations for SOL tokens over the medium to long term.
For traders utilizing advanced charting tools and technical analysis available on TradingView, the Solana price prediction represents an opportunity to participate in what could be one of the most significant appreciation cycles in the cryptocurrency’s history. The technical patterns and fundamental developments suggest that current price levels may represent optimal entry points for investors seeking exposure to Solana’s long-term growth potential.
The risk-reward profile for the $500 price target appears favorable when considering the substantial fundamental improvements in the Solana network, the technical pattern completion potential, and the broader cryptocurrency market expansion trends. However, investors should maintain appropriate risk management strategies and consider position sizing carefully, as cryptocurrency markets remain inherently volatile and unpredictable despite strong technical and fundamental analysis.
The confluence of technical and fundamental factors supporting the $500 price target suggests that Solana may be entering a major appreciation cycle that could establish new valuation benchmarks for the cryptocurrency. For investors seeking exposure to next-generation blockchain technology with superior technical capabilities and growing institutional adoption, Solana’s current risk-reward profile may represent one of the most compelling opportunities in the current cryptocurrency market landscape.
Disclaimer: This analysis is for educational and informational purposes only and should not be considered as financial advice. Cryptocurrency investments carry significant risks, including the potential for substantial losses. Past performance does not guarantee future results. Please conduct your own research and consult with qualified financial advisors before making investment decisions. The technical analysis and price predictions presented are based on current market conditions and technical patterns, which can change rapidly and unpredictably.